
How Business Intelligence Dashboards Improve Data-Driven Decision-Making
Businesses generate large amounts of data every day through sales transactions, customer interactions, marketing campaigns, financial activities, and operational processes. However, collecting information is only the first step. The real challenge is understanding that data and using it to make better business decisions.
Many organizations still rely on spreadsheets, manually prepared reports, and disconnected applications to monitor their performance. These methods can make it difficult to identify trends, track important metrics, and respond quickly to changing business conditions.
This is where Business Intelligence (BI) dashboards become valuable.
Business intelligence dashboards help organizations transform raw business data into meaningful visual insights. They bring important information together in one place, allowing managers and decision-makers to monitor performance, identify opportunities, and make informed decisions.
Whether you run a small business or manage a large organization, BI dashboards can improve visibility across departments and support more effective business planning.
In this article, we explore what business intelligence dashboards are, how they work, their key benefits, and how they help businesses make data-driven decisions.
What Is a Business Intelligence Dashboard?
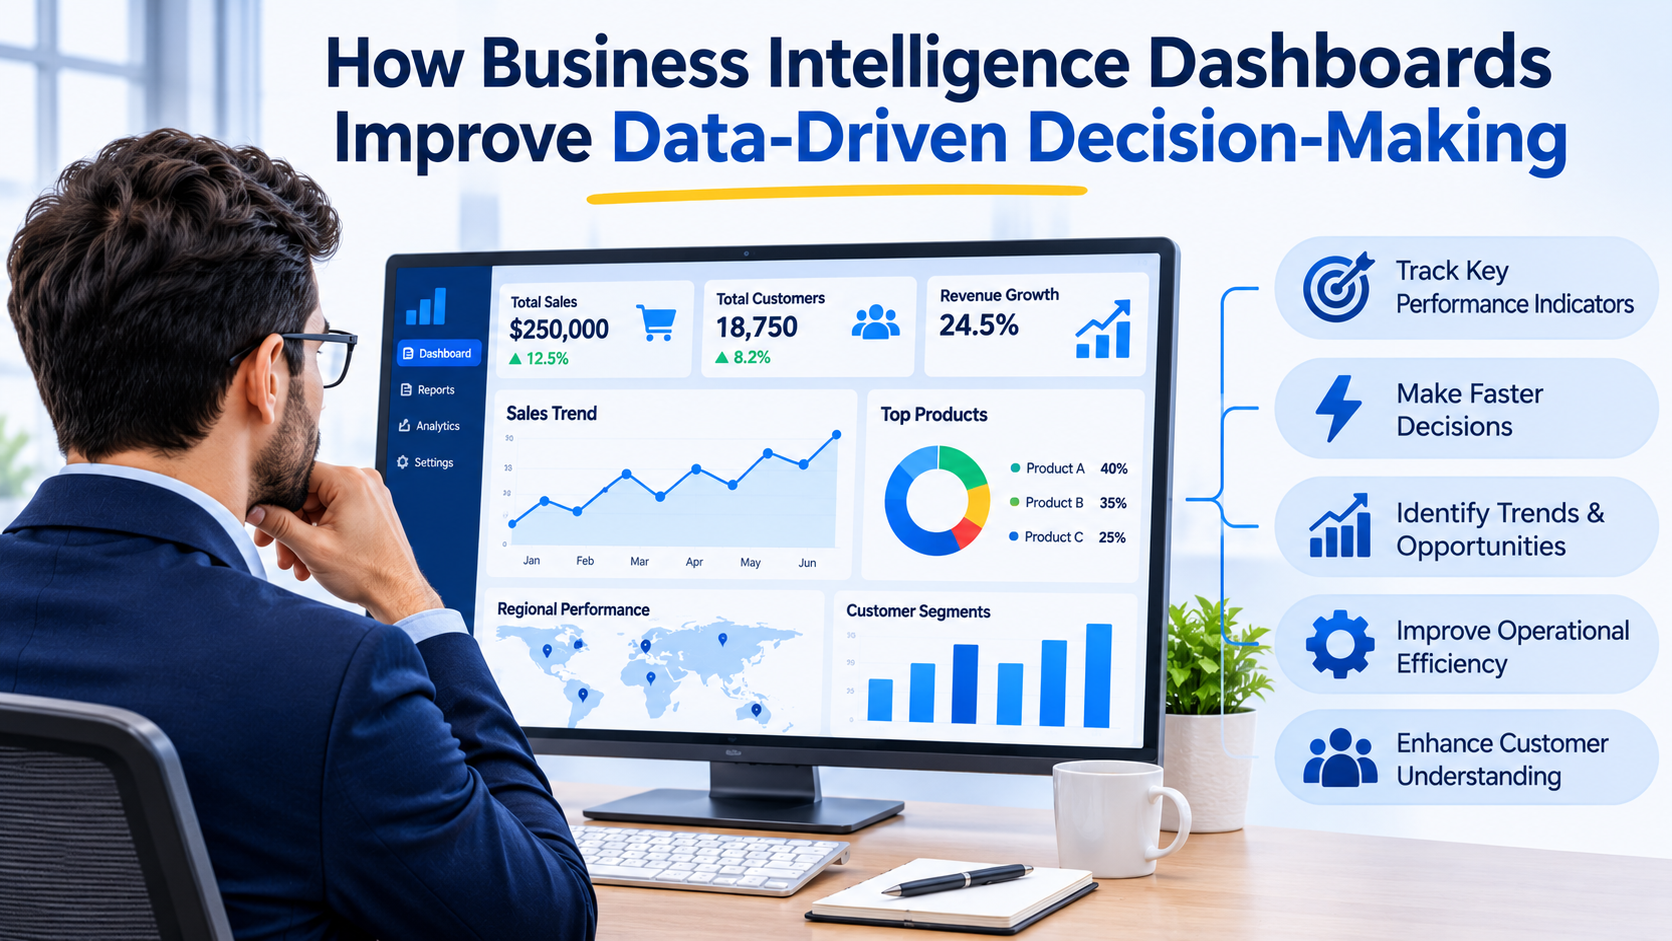
A Business Intelligence dashboard is a visual interface that displays important business information through charts, graphs, tables, indicators, and performance metrics.
It collects data from different sources and presents it in an organized format so users can understand business performance without manually reviewing multiple reports.
For example, a sales manager might use a BI dashboard to monitor:
- Total revenue and monthly sales.
- Sales performance by employee.
- Customer acquisition and retention.
- Lead conversion rates.
- Product performance.
- Regional sales trends.
Instead of collecting this information from separate spreadsheets and applications, the manager can view relevant metrics through a centralized dashboard.
BI dashboards can also support different levels of business management. Executives may monitor overall company performance, department managers may track team productivity, and operational employees may use dashboards to monitor daily activities.
The primary objective is to make business information easier to understand and act upon.
How Do Business Intelligence Dashboards Work?
Business intelligence dashboards work by collecting, processing, organizing, and visualizing data from different sources.
Although the technology behind each platform may differ, most BI dashboards follow a similar process.
1. Data Collection
The first step involves collecting information from different business systems.
Common data sources include:
- Customer Relationship Management (CRM) platforms.
- Enterprise Resource Planning (ERP) systems.
- Accounting and financial software.
- Sales and marketing applications.
- Inventory management systems.
- Website analytics platforms.
- Databases and spreadsheets.
For example, an eCommerce business may collect information from its online store, payment gateway, inventory system, and customer management platform.
2. Data Integration
After collecting information, the system brings data from different sources together.
This step may involve APIs, database connections, data pipelines, and integration tools.
The objective is to make information from multiple systems available in a consistent format.
Businesses with several disconnected applications can use third-party API integration services to connect their systems and establish a more reliable flow of information.
3. Data Processing and Transformation
Raw data may contain duplicate records, inconsistent formats, missing values, or unnecessary information.
Before displaying it on a dashboard, the system processes and organizes the data.
This may include:
- Removing duplicate records.
- Standardizing data formats.
- Calculating business metrics.
- Combining information from different sources.
- Applying business rules.
- Organizing data for reporting.
Accurate processing is essential because incorrect or incomplete information can lead to misleading business insights.
4. Data Visualization
Once the data is prepared, the dashboard presents it through visual elements.
Common visualization formats include:
- Bar charts for comparing performance.
- Line charts for identifying trends over time.
- Pie charts for understanding proportions.
- Tables for detailed information.
- KPI cards for displaying important metrics.
- Maps for comparing regional performance.
The dashboard should present information clearly so users can quickly understand what is happening within the business.
5. Monitoring and Reporting
The final stage involves using the dashboard to monitor performance and support decision-making.
Depending on the system, information may refresh in real time, at scheduled intervals, or whenever new data becomes available.
Users can apply filters, compare time periods, explore specific departments, and generate reports based on their requirements.
10 Ways Business Intelligence Dashboards Improve Data-Driven Decision-Making
Business intelligence dashboards provide more than visual reports. They help organizations understand performance, identify problems, and make decisions based on measurable information.
Here are ten important ways they support better business decisions.
1. Provide a Centralized View of Business Performance
One of the biggest challenges businesses face is managing information across multiple applications.
Sales information may be stored in a CRM, financial data in accounting software, and operational records in separate databases.
This makes it difficult for managers to understand overall business performance.
BI dashboards bring relevant information together in one centralized interface.
For example, an executive dashboard can display revenue, expenses, customer acquisition, employee productivity, and operational performance in one place.
This provides a clearer picture of how different departments contribute to business objectives.
Managers can also identify areas that require attention without waiting for separate reports from every department.
2. Enable Faster and More Informed Decisions
Traditional reporting methods often require employees to collect data, prepare spreadsheets, and create presentations before management can review business performance.
This process can delay important decisions.
BI dashboards simplify reporting by presenting relevant information in an accessible format.
For example, if a sales manager notices that monthly revenue is below target, they can immediately review sales performance, customer conversion rates, and regional results.
Instead of waiting for another report, the manager can investigate the issue and decide what action is required.
Faster access to reliable information helps businesses respond more effectively to changing conditions.
3. Help Track Key Performance Indicators (KPIs)
Key Performance Indicators (KPIs) are measurable values that help businesses evaluate progress toward specific goals.
However, tracking multiple KPIs manually can become complicated, particularly when information comes from different departments.
BI dashboards allow organizations to monitor important performance indicators through dedicated visual sections.
Examples include:
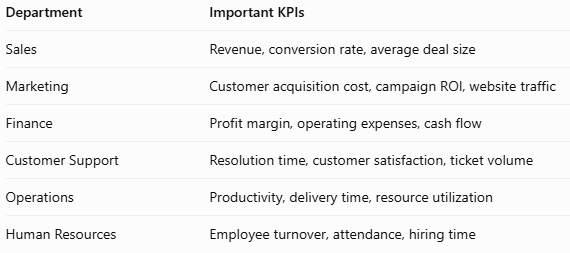
Managers can compare current performance with historical data and business targets to identify whether their teams are meeting expectations.
4. Identify Trends and Business Opportunities
Historical business data can reveal patterns that may not be obvious through individual reports.
BI dashboards make it easier to compare information across different time periods and identify changes in performance.
For example, a retail company may discover that certain products experience higher demand during specific months. This information can help management plan inventory, marketing campaigns, and promotional activities.
Similarly, a service business may identify which customer segments generate the highest revenue.
By understanding these patterns, businesses can make more informed decisions about resource allocation, pricing, marketing, and product development.
5. Improve Financial Planning and Budget Management
Financial decisions require accurate information about revenue, expenses, cash flow, and profitability.
Without proper reporting, businesses may struggle to identify unnecessary spending or understand their financial position.
A financial BI dashboard can display:
- Revenue and expenditure.
- Monthly profit and loss.
- Budget utilization.
- Outstanding invoices.
- Cash flow trends.
- Department-wise expenses.
- Financial forecasts.
For example, if a department consistently exceeds its allocated budget, management can investigate the reasons and adjust spending plans.
Having financial information available through a centralized dashboard helps businesses monitor budgets and make more informed financial decisions.
6. Improve Customer Understanding
Understanding customer behavior is essential for improving products, services, and marketing strategies.
BI dashboards can combine customer information from CRM platforms, sales systems, support applications, and marketing tools.
This allows businesses to monitor:
- Customer acquisition trends.
- Repeat purchase rates.
- Customer retention.
- Customer lifetime value.
- Purchase patterns.
- Support requests and complaints.
- Customer satisfaction scores
For example, an eCommerce company may discover that customers who purchase a particular product are more likely to return for related products.
The business can use this information to improve recommendations, create targeted campaigns, and develop better customer engagement strategies.
7. Improve Operational Efficiency
Operational inefficiencies can increase costs, delay deliveries, and reduce productivity.
BI dashboards help businesses monitor daily activities and identify areas where processes are not performing as expected.
For example, a manufacturing company may use a dashboard to track production output, equipment downtime, material usage, and order completion rates.
If production delays increase, managers can examine the relevant metrics to identify possible causes.
This information can support improvements in scheduling, resource allocation, inventory management, and workflow planning.
8. Support Predictive Analysis and Future Planning
Traditional dashboards mainly focus on displaying historical and current performance. However, more advanced business intelligence solutions can also support predictive analytics.
By analyzing historical information and identifying patterns, businesses can estimate possible future outcomes.
For example:
- Retailers can forecast product demand.
- Financial teams can estimate cash flow requirements.
- Marketing departments can predict campaign performance.
- Manufacturers can identify potential maintenance requirements.
- SaaS companies can analyze customer churn patterns.
Predictive analytics does not guarantee accurate future outcomes. Results depend on data quality, analytical methods, and changing business conditions.
However, it can provide useful insights that help organizations prepare for potential opportunities and challenges.
9. Improve Collaboration Across Departments
When departments use different reporting systems, employees may work with inconsistent information.
This can create communication gaps and make it difficult to coordinate business activities.
A centralized BI dashboard can provide teams with access to consistent performance information based on their roles and permissions.
For example, the sales and marketing departments can monitor lead generation and conversion metrics together. Finance and operations teams can review expenses alongside resource utilization.
This shared visibility encourages collaboration and helps departments work toward common business objectives.
10. Reduce Dependence on Manual Reporting
Preparing business reports manually can consume significant employee time.
Employees may need to export data, clean spreadsheets, calculate metrics, create charts, and prepare presentations repeatedly.
BI dashboards can automate many reporting activities by connecting to data sources and updating visual reports according to configured schedules.
This reduces repetitive reporting work and allows employees to spend more time analyzing information and improving business processes.
Businesses can also introduce custom software development when standard reporting platforms cannot accommodate their specific workflows, data structures, or dashboard requirements.
Types of Business Intelligence Dashboards
Different departments require different types of information. Therefore, organizations may use multiple dashboards depending on their business objectives.
Here are four common types.
1. Strategic Dashboards
Strategic dashboards provide high-level information to executives and senior management.
They focus on long-term business performance and organizational objectives.
Common metrics include:
- Annual revenue growth.
- Profitability.
- Market performance.
- Customer retention.
- Strategic project progress.
These dashboards help leadership understand whether the organization is moving toward its long-term goals.
2. Operational Dashboards
Operational dashboards focus on daily business activities.
They help managers and employees monitor processes, identify delays, and respond to operational issues.
For example, a logistics company may track delivery status, shipment delays, vehicle utilization, and order processing time.
These dashboards are useful for businesses that need regular visibility into operational performance.
3. Analytical Dashboards
Analytical dashboards help users explore historical data, identify patterns, and understand business trends.
They often include filters, comparisons, drill-down features, and advanced visualizations.
For example, a marketing team may compare campaign performance across different channels, customer groups, and time periods.
4. Tactical Dashboards
Tactical dashboards support department managers and team leaders who need to monitor medium-term objectives and departmental performance.
For example, a sales manager may use a tactical dashboard to compare quarterly targets, team productivity, and regional revenue.
These dashboards help translate broader business goals into measurable departmental activities.
Essential Features of an Effective Business Intelligence Dashboard
Not all dashboards provide the same level of functionality. An effective BI dashboard should be easy to understand, relevant to business requirements, and capable of presenting reliable information.
Some important features include:
1. Real-Time or Scheduled Data Updates
Dashboards should refresh information according to business requirements. Some organizations need near-real-time visibility, while others can work with daily or weekly updates.
2. Interactive Visualizations
Users should be able to explore information through charts, filters, and drill-down functionality rather than relying only on static reports.
3. Role-Based Access Control
Employees should only access information relevant to their responsibilities. For example, financial dashboards may require restricted access.
4. Customizable Reports
Different departments need different metrics. A dashboard should allow users to view relevant information according to their reporting requirements.
5. Data Integration
The system should connect with relevant databases, CRM platforms, ERP software, and other business applications.
6. Mobile Accessibility
Managers and authorized employees may need to review important metrics while working remotely or traveling.
7. Alerts and Notifications
Dashboards can notify users when important metrics cross predefined thresholds, such as low inventory, missed sales targets, or unusual operational activity.
8. Export and Sharing Options
Users may need to export reports or share selected insights with relevant stakeholders.
Common Challenges in Implementing BI Dashboards
Although BI dashboards offer significant benefits, successful implementation requires proper planning.
Businesses should consider the following challenges.
Poor Data Quality
Inaccurate, incomplete, or duplicate information can produce misleading reports.
Organizations should establish data validation, standardization, and cleaning processes before relying on dashboard insights.
Data Integration Difficulties
Connecting multiple applications can be challenging, particularly when systems use different formats, databases, or integration methods.
Businesses should identify their data sources and integration requirements before selecting a BI platform.
Too Many Metrics
Displaying too much information can make dashboards confusing and reduce their usefulness.
It is better to prioritize metrics that directly support business objectives.
Lack of User Adoption
A technically advanced dashboard may not deliver value if employees do not understand how to use it.
Businesses should provide training and involve relevant teams during dashboard planning and development.
Security and Privacy Concerns
BI dashboards may display confidential financial, employee, and customer information.
Organizations should implement appropriate authentication, access permissions, encryption, and monitoring practices.
How to Implement a Business Intelligence Dashboard
Building an effective dashboard requires more than selecting charts and connecting databases. Businesses should follow a structured implementation process.
Step 1: Define Business Objectives
Start by identifying the decisions the dashboard should support.
For example, your objectives may include improving sales visibility, monitoring financial performance, reducing operational delays, or understanding customer behavior.
Step 2: Identify Important KPIs
Select metrics that directly relate to your business goals.
Avoid adding unnecessary indicators simply because the data is available.
Step 3: Identify Data Sources
Determine where the required information is stored.
This may include databases, spreadsheets, CRM systems, ERP platforms, accounting applications, and third-party services.
Step 4: Prepare and Integrate Data
Connect the required sources and establish processes for cleaning, transforming, and validating information.
Businesses should also define how frequently data needs to be refreshed.
Step 5: Select the Right BI Technology
Choose a suitable business intelligence platform based on your reporting requirements, data sources, budget, scalability, and technical resources.
Step 6: Design the Dashboard
Create a user-friendly interface that displays the most important metrics clearly.
Use appropriate charts, tables, filters, and visual indicators to make information easy to understand.
Step 7: Test and Validate the Results
Before launching the dashboard, verify calculations, data accuracy, access permissions, and reporting behavior.
The displayed information should match the original data sources.
Step 8: Monitor and Improve
Business requirements change over time. Review dashboard usage and collect feedback from employees to identify opportunities for improvement.
Update metrics and reports as business objectives evolve.
Final Thoughts
Business intelligence dashboards help organizations move beyond traditional reporting and make better use of the data they generate every day.
By bringing information together, tracking important KPIs, identifying trends, and automating reporting activities, dashboards improve visibility across business operations.
They also help managers make faster decisions, understand customer behavior, monitor financial performance, and identify areas that need improvement.
However, the value of a BI dashboard depends on the quality of its data, the relevance of its metrics, and how effectively employees use the insights.
Businesses should begin with clear objectives, reliable data sources, and dashboards designed around actual decision-making requirements.
With the right implementation strategy, business intelligence dashboards can become an important tool for improving operational efficiency, supporting business growth, and building a data-driven organization.
Frequently Asked Questions (FAQs)
1. What is the main purpose of a business intelligence dashboard?
The main purpose of a BI dashboard is to transform business data into understandable visual information. It helps organizations monitor performance, track KPIs, identify trends, and make informed decisions.
2. How do BI dashboards help businesses make better decisions?
BI dashboards provide centralized access to relevant business information. Managers can compare performance, identify problems, evaluate trends, and take action based on measurable data instead of relying entirely on assumptions.
3. What are the most important KPIs to include in a BI dashboard?
Important KPIs depend on business objectives. Common examples include revenue, profit margin, customer acquisition cost, conversion rate, customer retention, operational efficiency, and employee productivity.
4. What is the difference between a BI dashboard and a traditional report?
A traditional report generally presents information in a structured document or spreadsheet. A BI dashboard provides a visual and often interactive view of business metrics, allowing users to monitor performance and explore information more easily.
5. Can small businesses benefit from business intelligence dashboards?
Yes. Small businesses can use BI dashboards to monitor sales, expenses, customer activity, inventory, and marketing performance. They can start with a few important KPIs and expand as their requirements grow.
6. Do BI dashboards provide real-time data?
Some dashboards support real-time or near-real-time updates, while others refresh information at scheduled intervals. The update frequency depends on the platform, data sources, and business requirements.
7. Which tools are used to build business intelligence dashboards?
Popular BI tools include Microsoft Power BI, Tableau, and Looker. Businesses can also develop custom dashboards using suitable frontend frameworks, backend technologies, and database integrations when their requirements go beyond standard reporting platforms.
8. Is custom BI dashboard development necessary?
Not always. Ready-made BI platforms are suitable for many reporting requirements. Custom dashboard development may be useful when businesses need specialized workflows, unique visualizations, complex integrations, or greater control over functionality.
About the author
- LnP Infotech Pvt. Ltd. is an AI technology consulting and digital solutions company based in Mohali, India, serving businesses worldwide. Founded in 2018, we specialize in custom software development, AI solutions, automation, web and mobile app development, SaaS solutions, and technology consulting. Our expertise includes finance and healthcare software, real estate technology, reporting and analytics, digital transformation, and business process automation. We help businesses modernize legacy systems, streamline operations, improve efficiency, and build scalable digital products tailored to their requirements. With an experienced technology team and a practical, future-ready approach, LnP Infotech delivers reliable software and technology solutions that support sustainable business growth.
Comments
Join the discussionNo comments yet. Be the first to comment.